
Accounts
Account Story Viewer
-
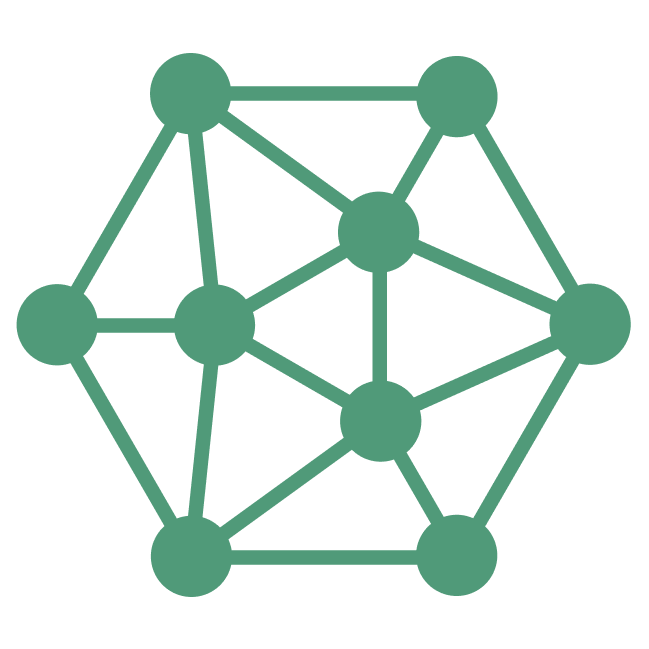
The Account Story Viewer page helps you explore everything that happened in the selected account.
-
The search/selector dropdown at the top can search by account name, or Salesforce account ID.
-
Click any row in the touchpoint table to view more details about that touchpoint.
Buying group selector
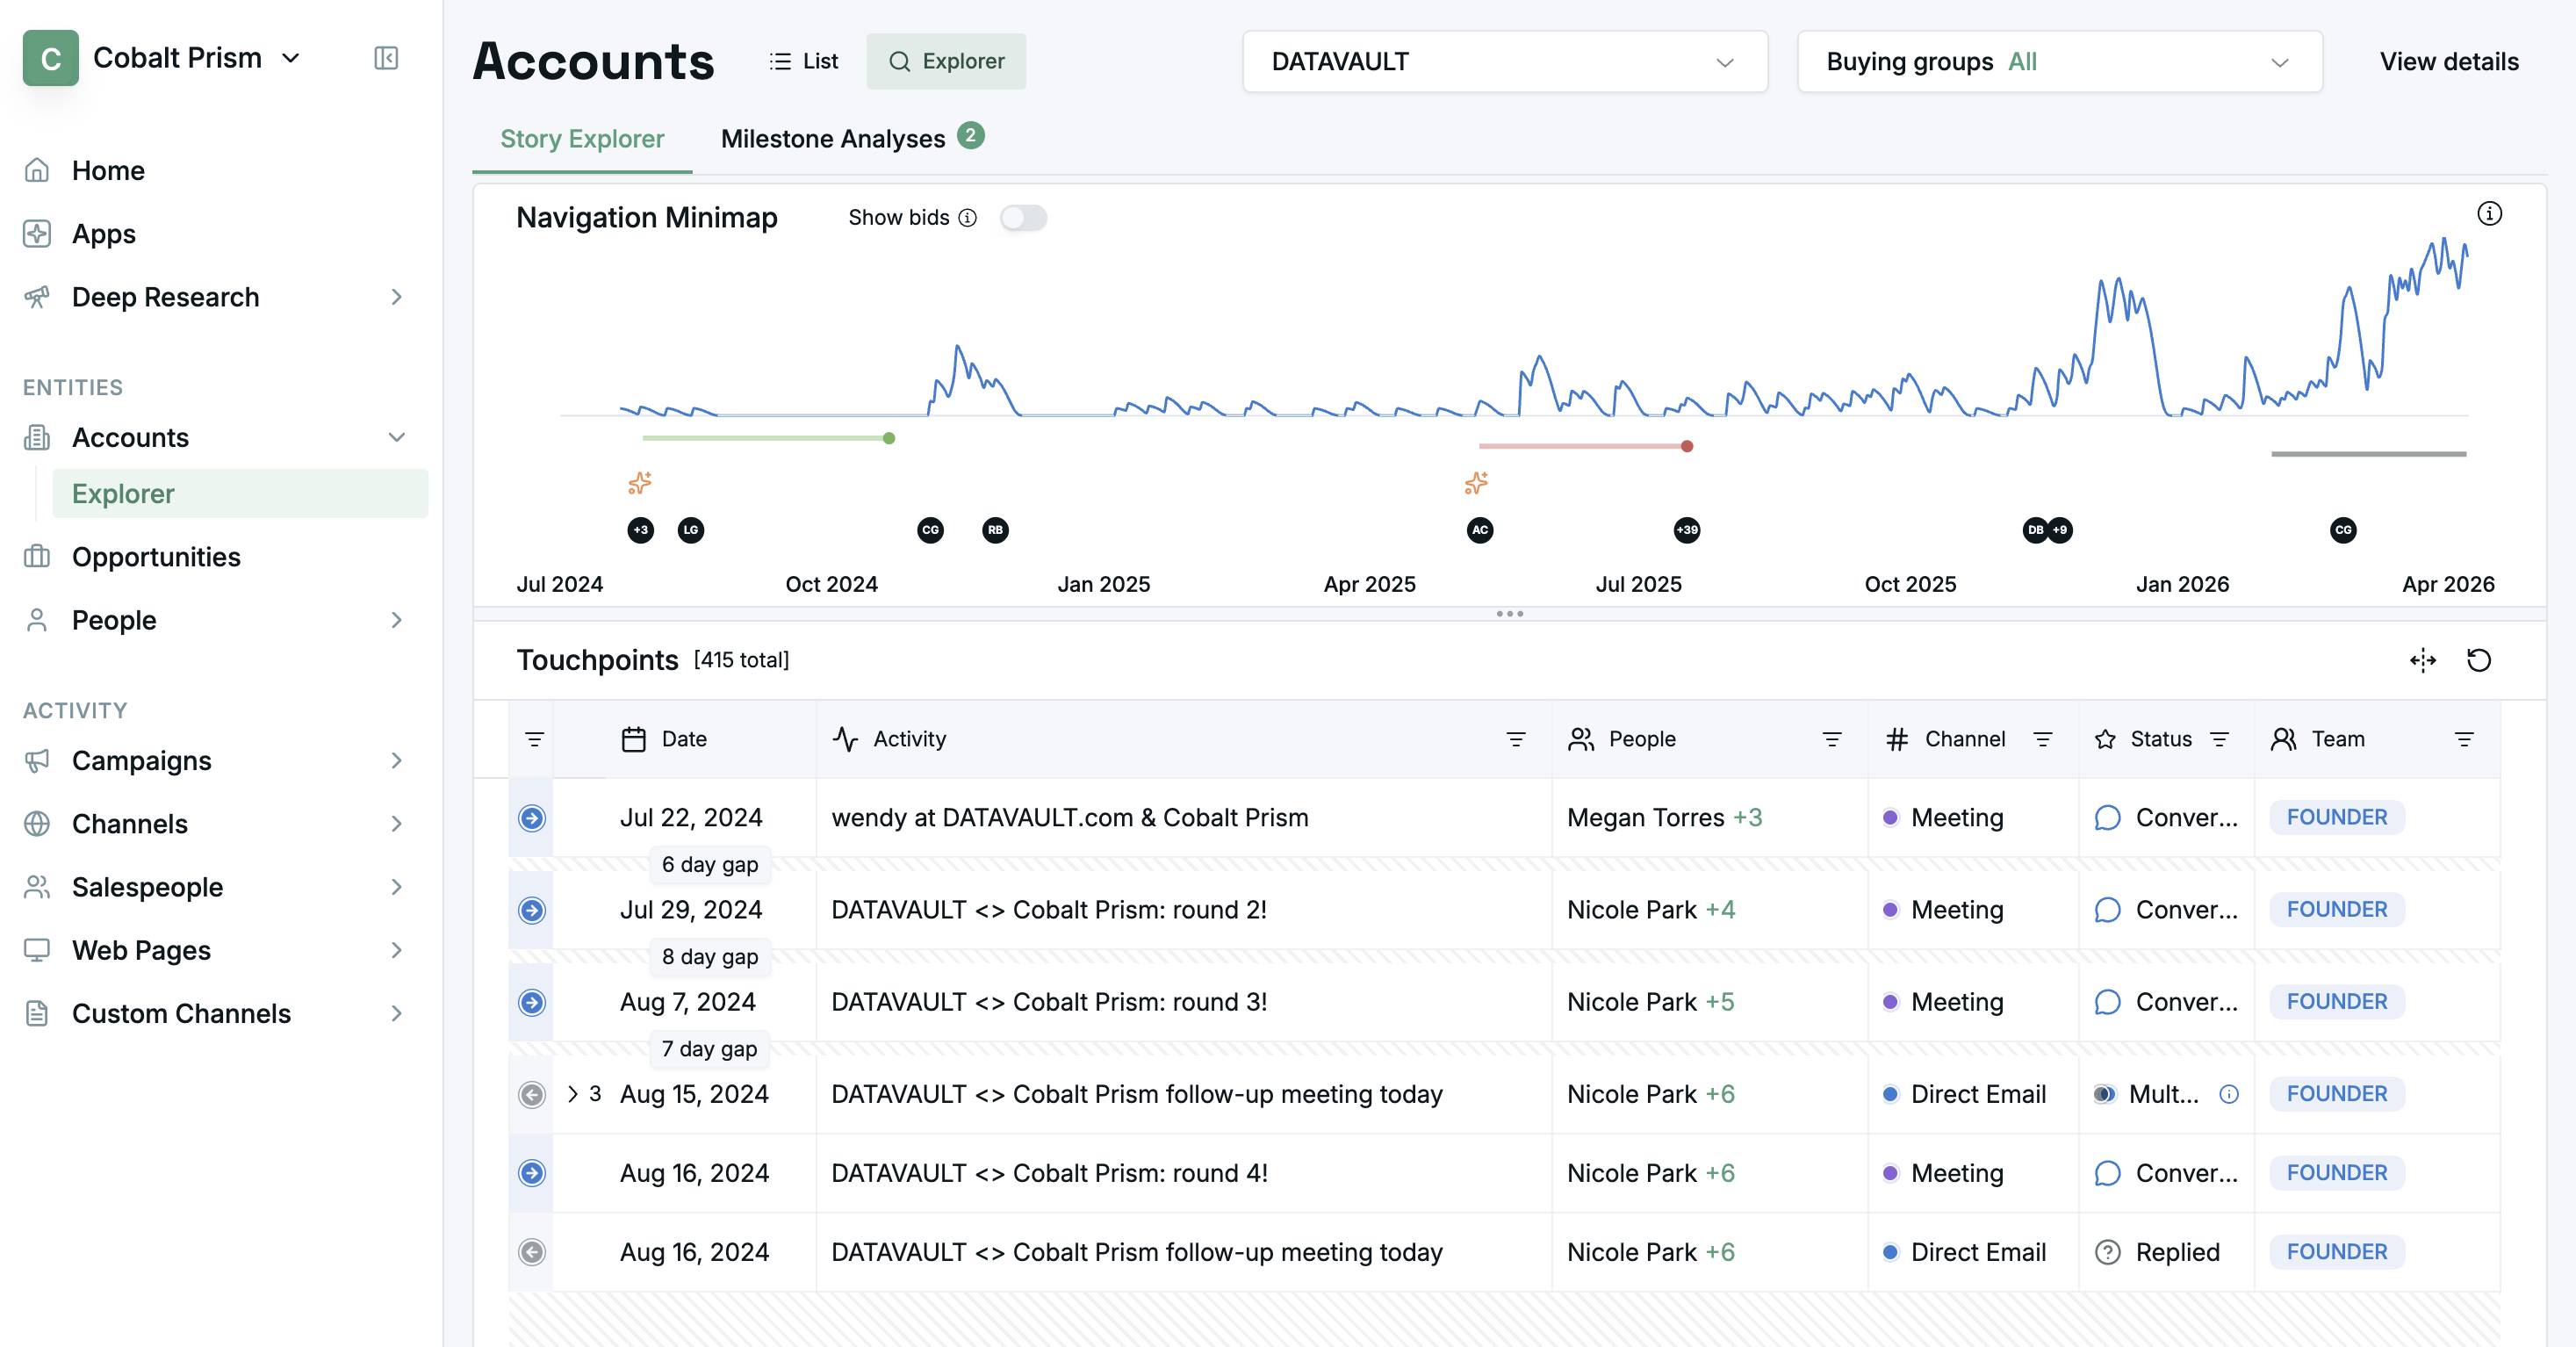
- Use this drop-down to focus on only activity related to a specific opportunity.
- For more info on how we determine buying groups, please read How do Enhanced Buying Groups work?
Minimap
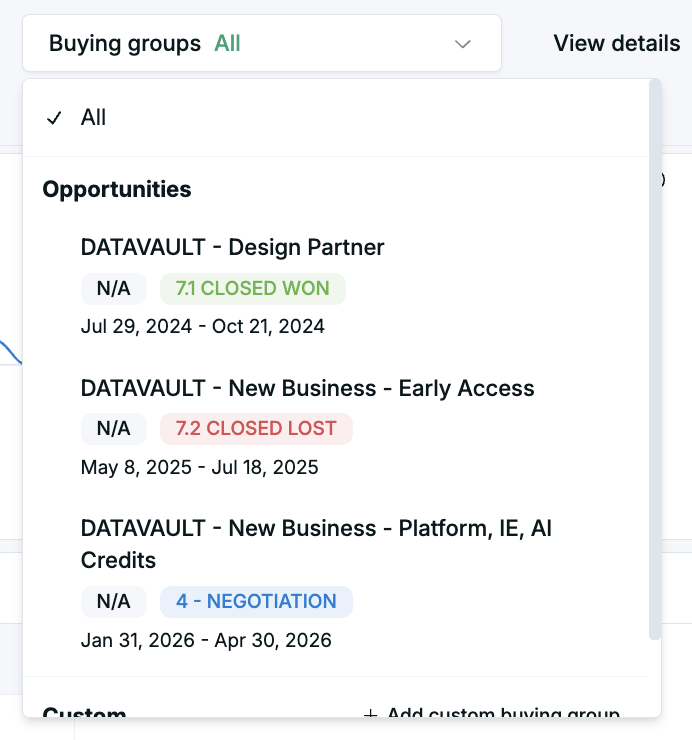
- Use this view to help see where ‘interesting things’ were happening in the account’s history.
- Velocity Sparkline: Indicates the momentum of engagement coming from the account over time. Higher peaks indicate more incoming engagement.
- Opportunity Timeline: Colored bars represent opportunities:
- Green - Won opportunities
- Red - Lost opportunities
- Grey - Active opportunities
- Color shades indicate stage progression - lighter shades represent earlier stages, and darker shades represent later stages in the opportunity lifecycle.
New Person Engagements Circles: indicates first actions from a new person in the account. Hover over each circle to see person details
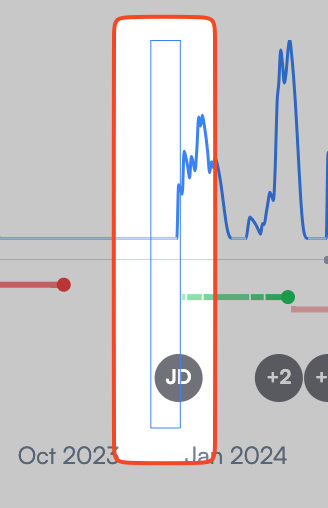
Focused Touchpoint Period: this represents the period of the touchpoint timeline currently visible in the table below the minimap.
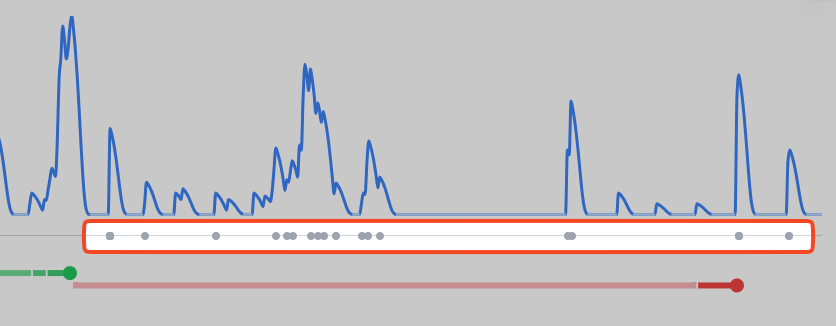
Filtered Activity Markers: Small dots along the timeline show when filtered activities occurred. These appear when you use the filters below the chart (people, channels, teams, or search).
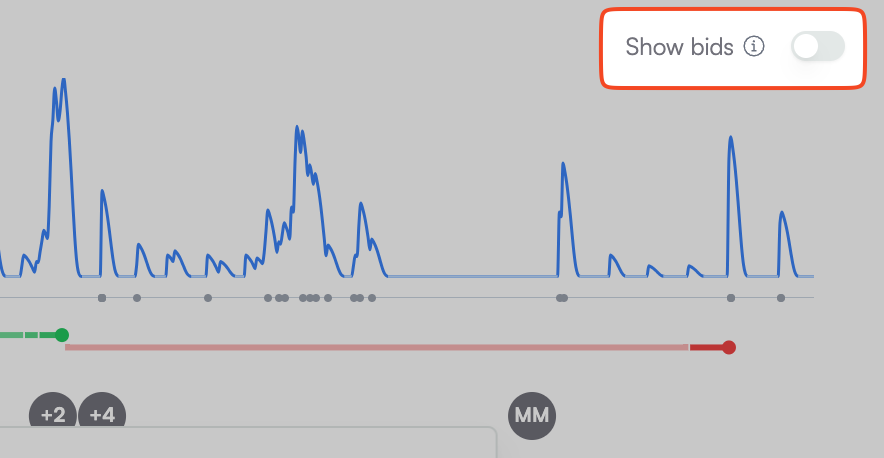
Show Bids: use this toggle to switch between showing only engagements (touchpoints from customer/prospect contacts), or both engagements and bids (touchpoints from your own teams).
Account List View
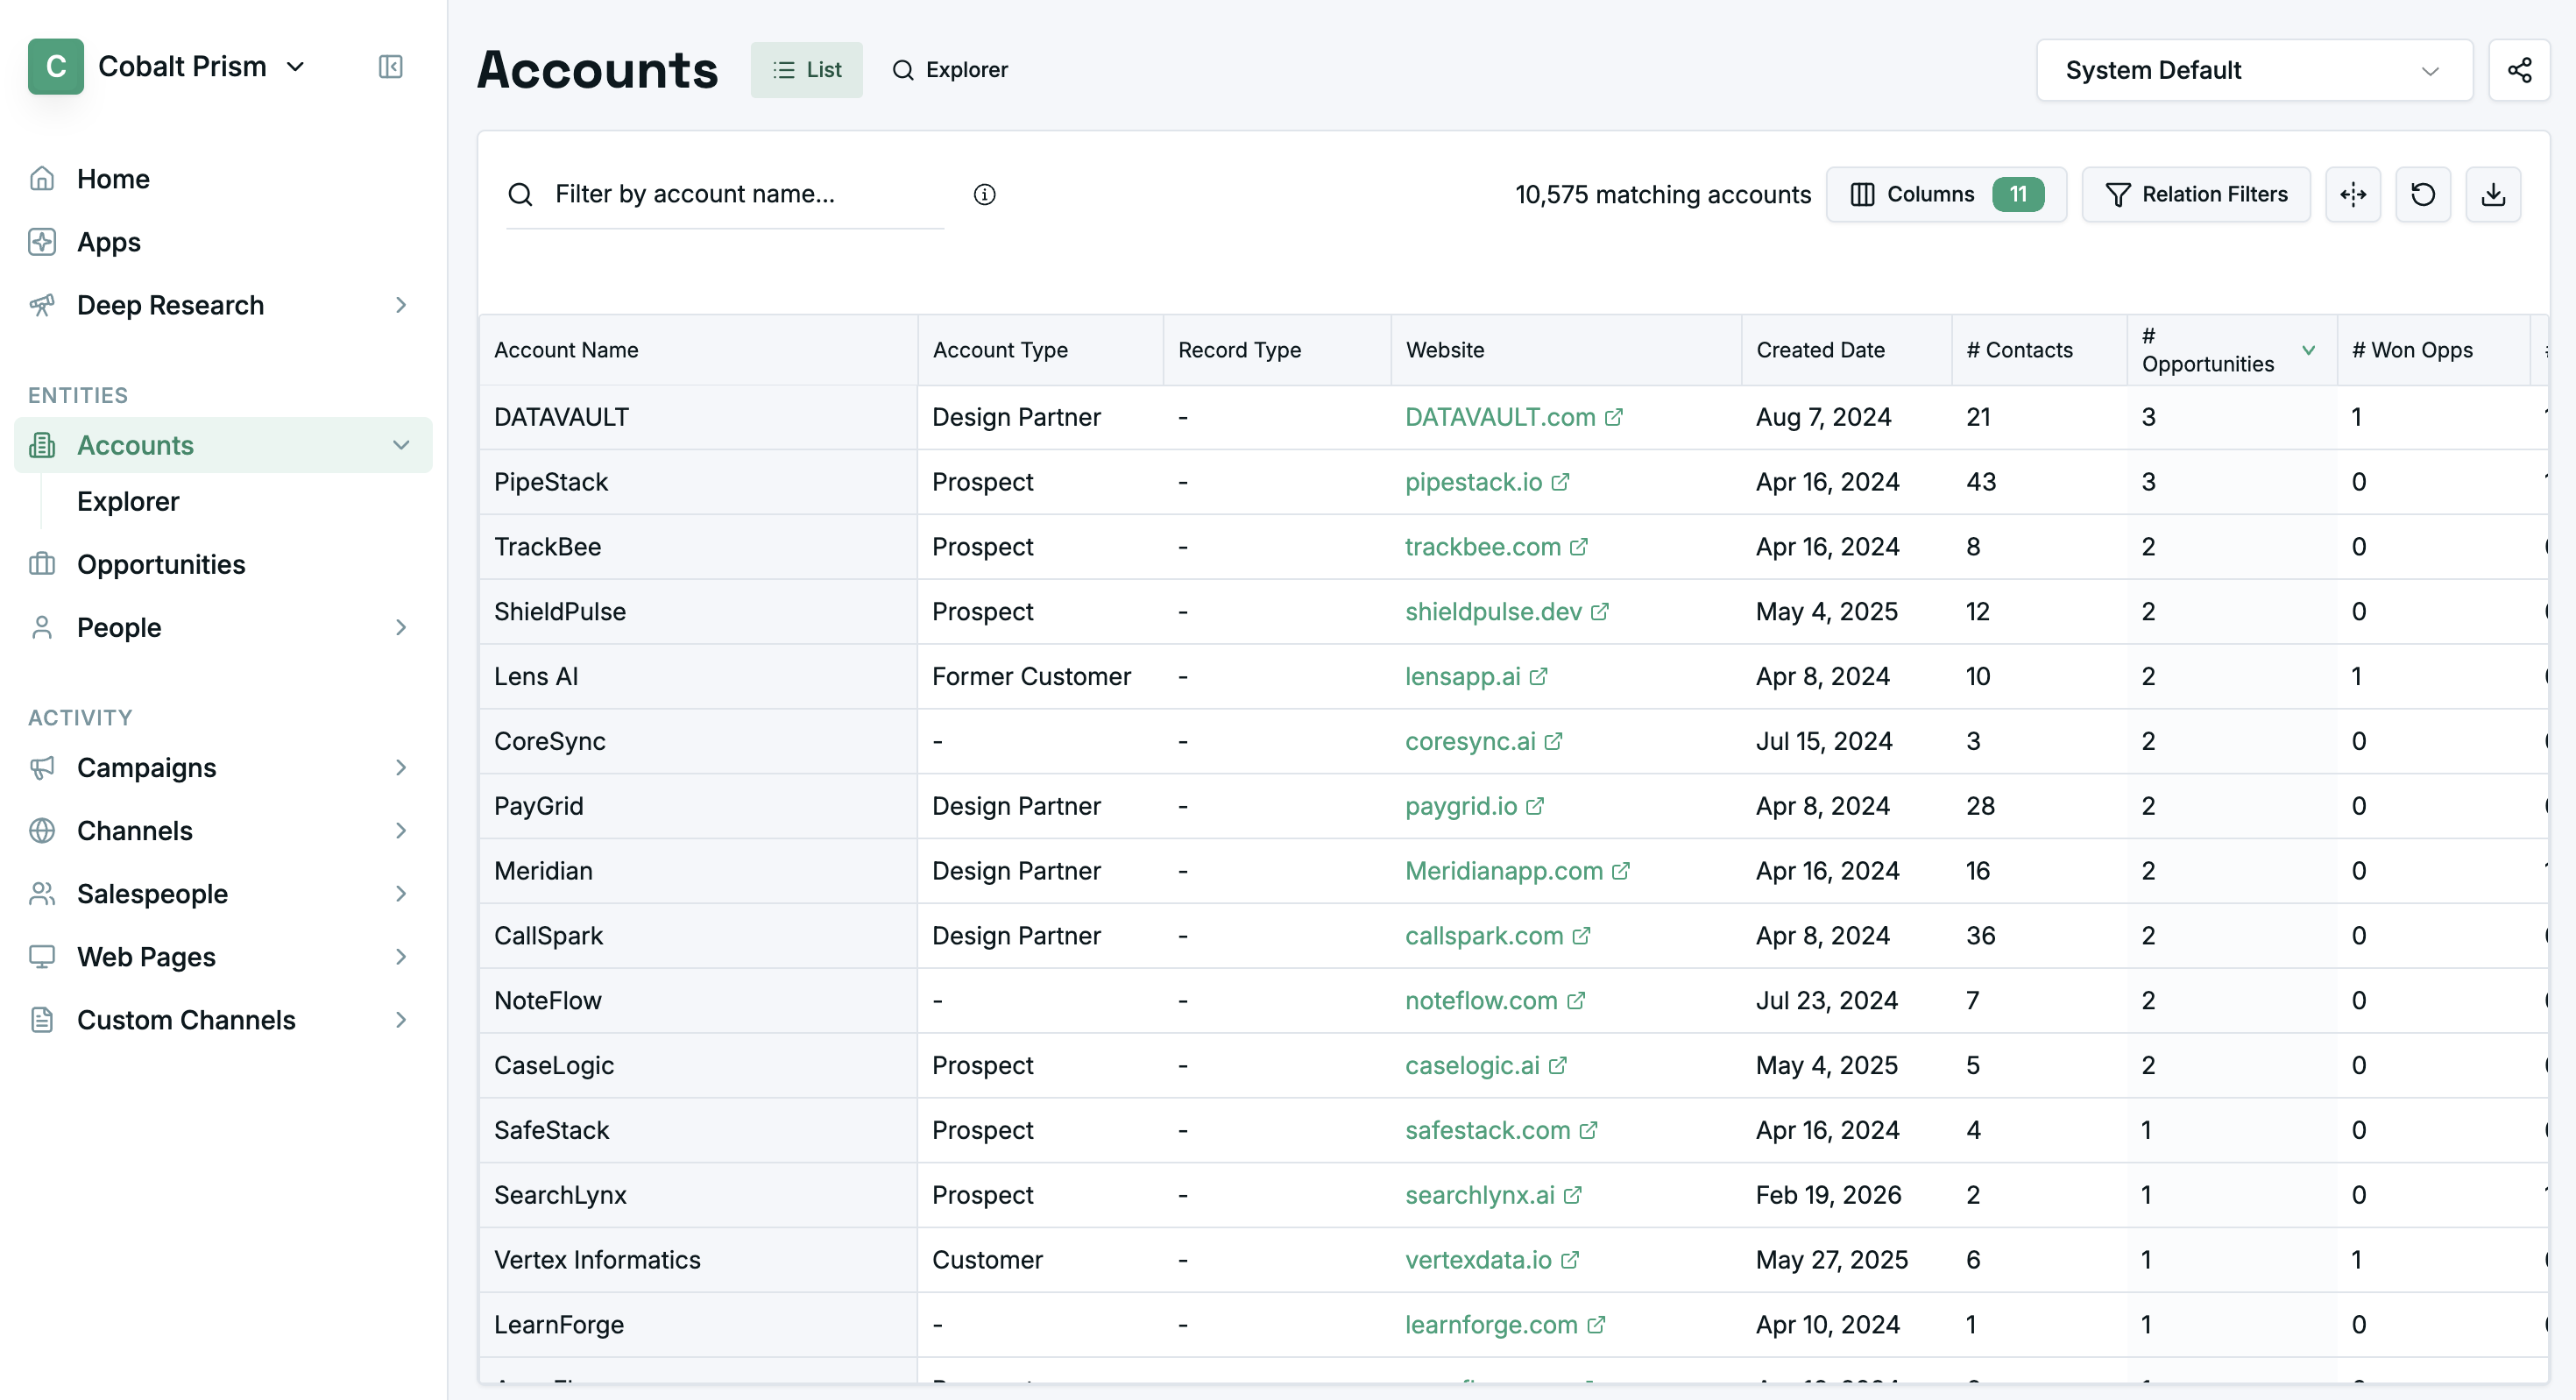
- The Account List View page displays a list of all accounts, to help you more easily find the account you want to explore.
- You can filter the results by using the header of any of the columns and select/deselect the visible columns and metrics.
- You can click on any account name to view more details.