Channels
Channel Report Card
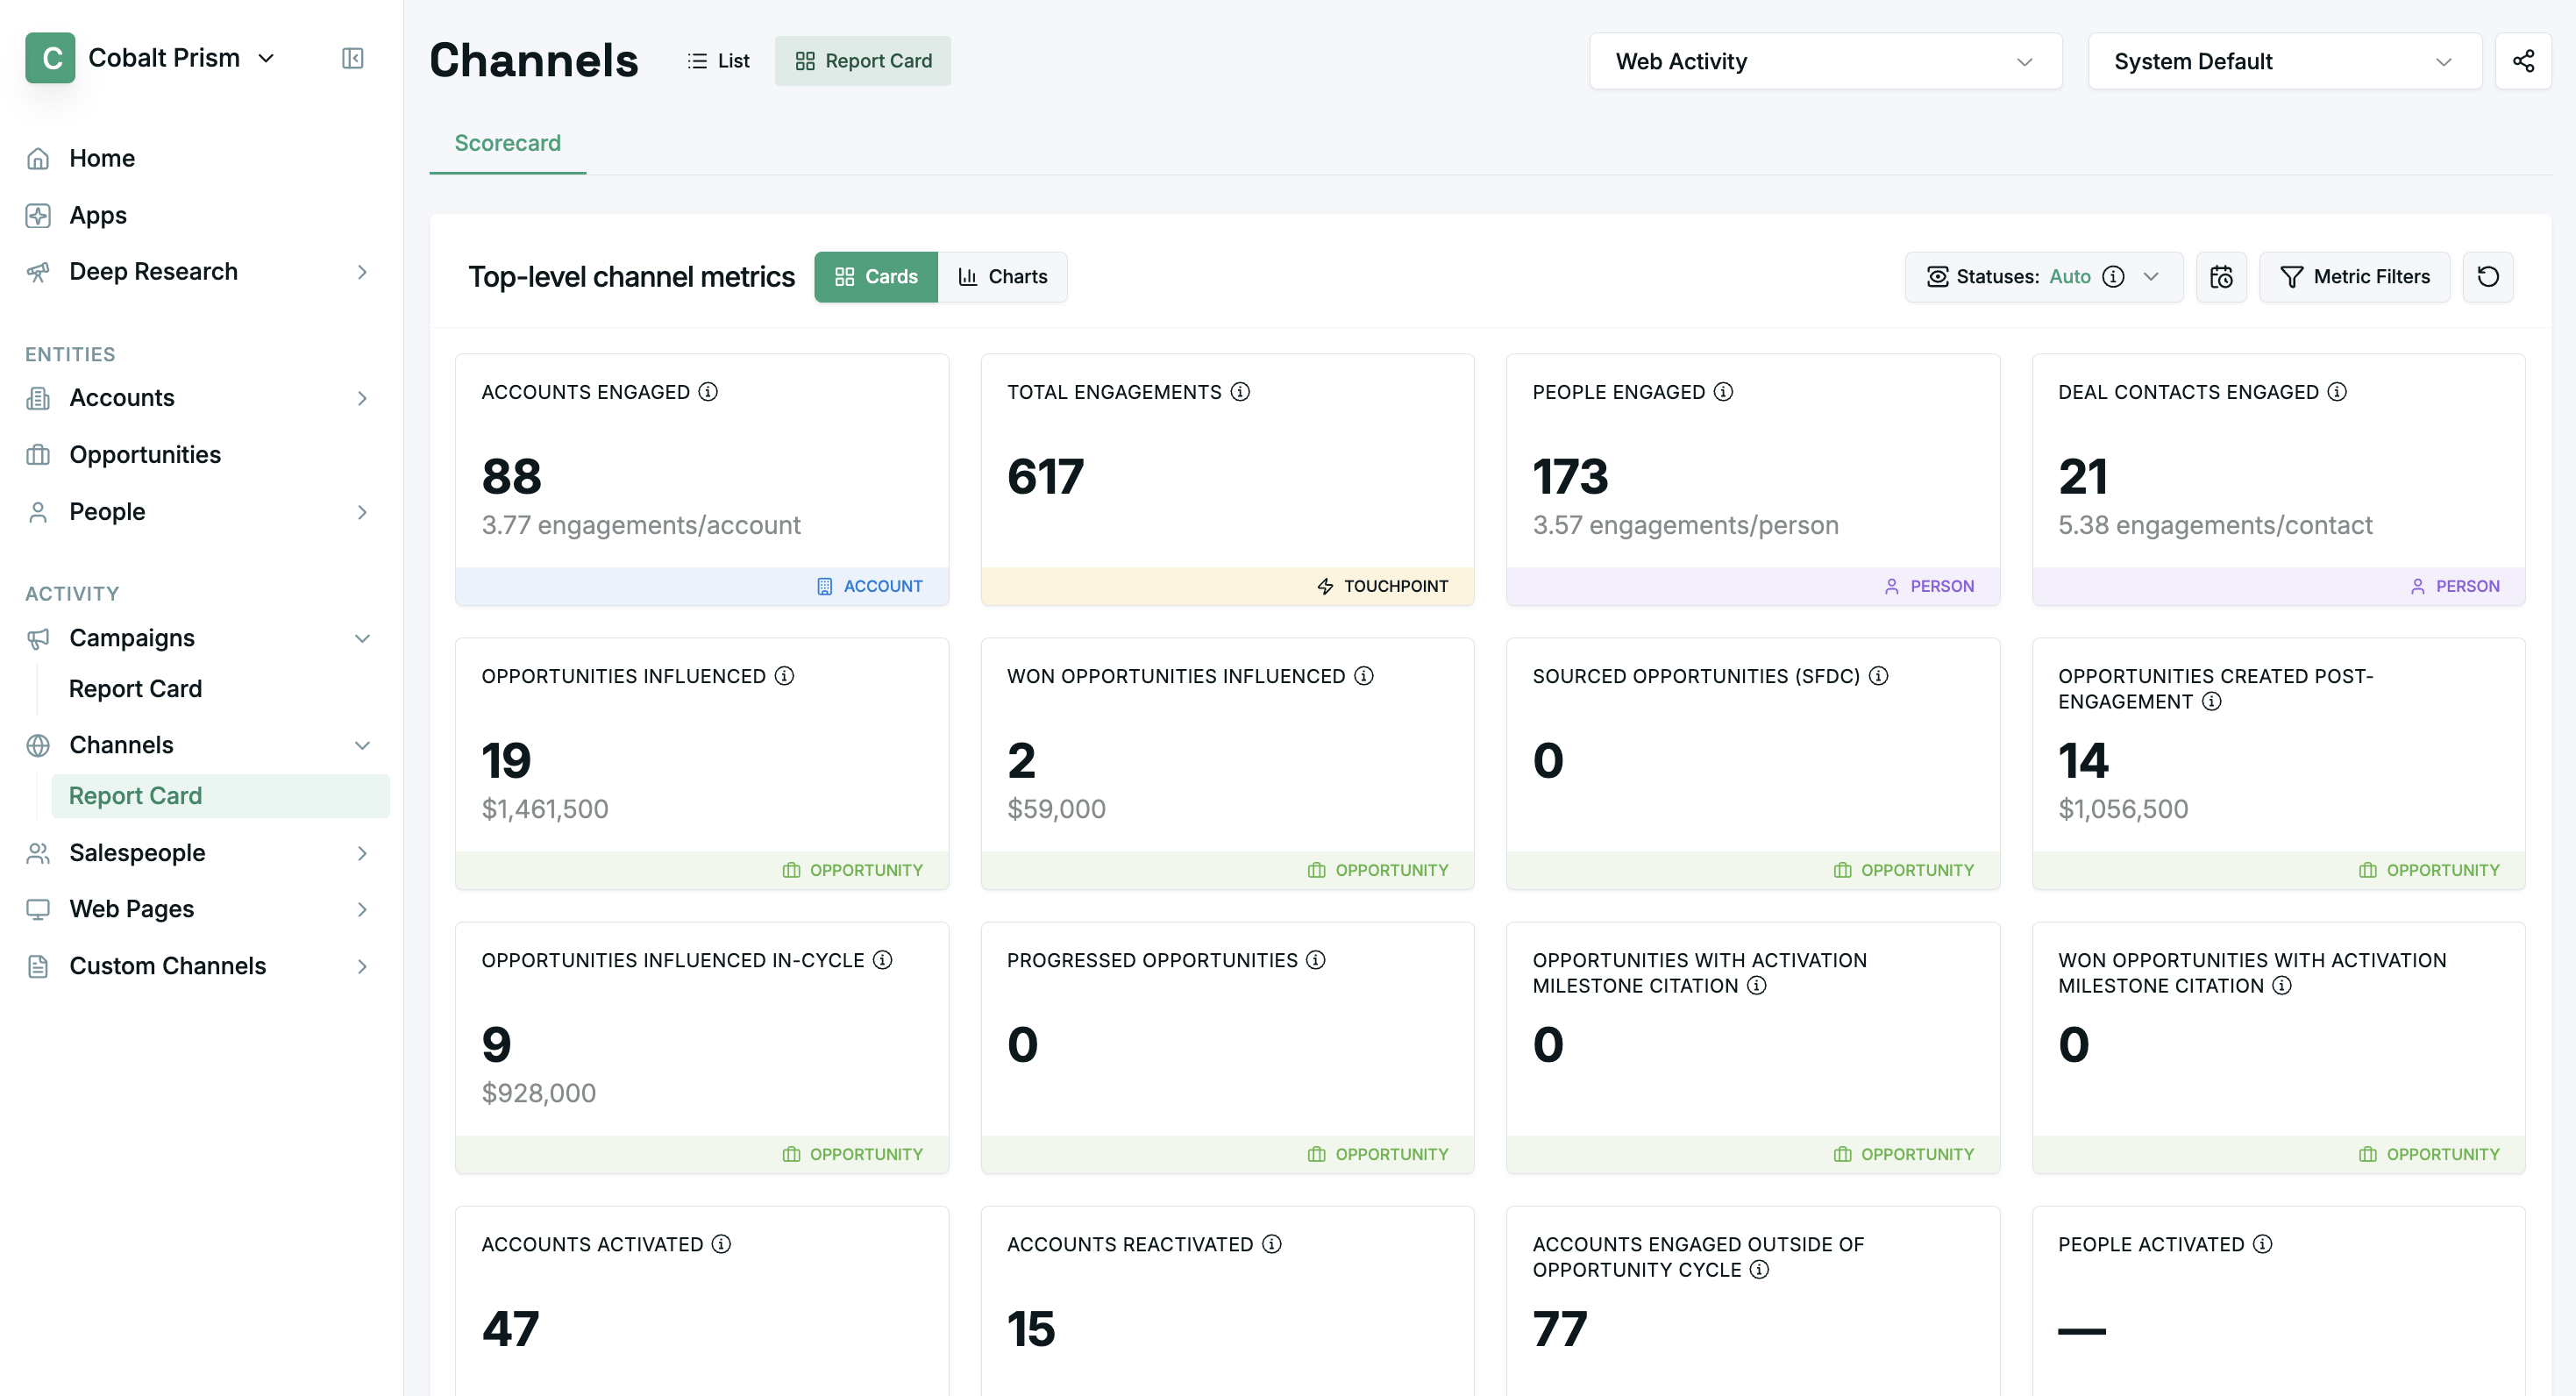
- The Channel Report Card page displays metrics for a single selected channel.
- Cards can be dragged into your preferred order.
- The displayed metrics can be filtered by Account, Opportunity, and Touchpoint timestamp range.
Engagement Status Selector
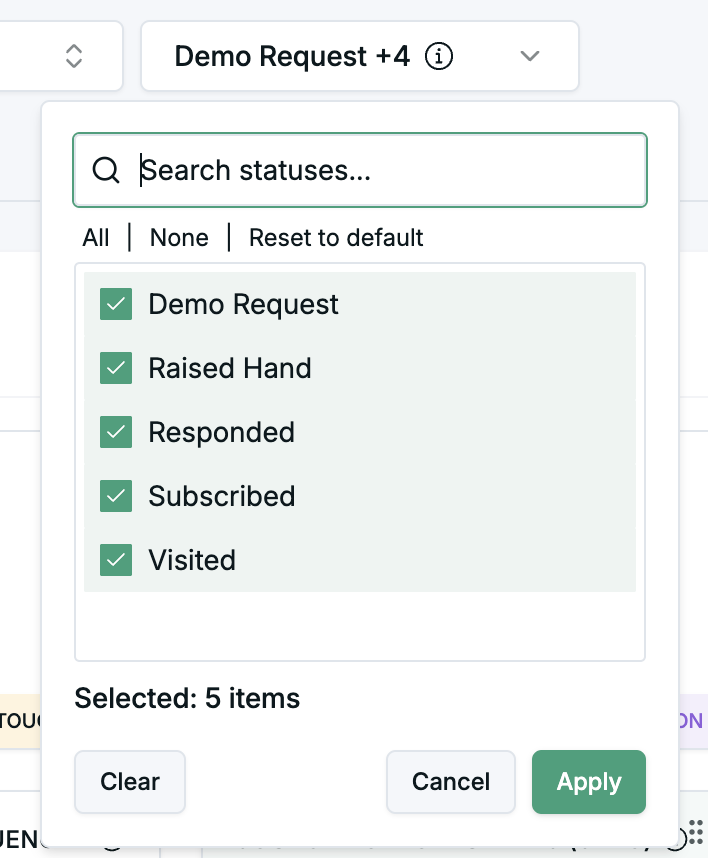
- Use this drop-down menu to select which channel response statuses should be considered as ‘engagements’ for the purposes of reporting.
- The report card will remember which statuses you select for a given channel, and use the same selection on future visits.
- Note: this is stored locally in your browser, which means your selections will not be persisted across devices or to other members of your team.
Metrics Reference
The Channel Report Card page provides cards for each of the metrics below.
| Metric | Description |
|---|---|
| Accounts engaged | Count of accounts where any person engaged with this channel. |
| Total engagements | Count of total engagements for this channel (may include more than one per person). Excludes any engagements from your own team. |
| People engaged | Count of people who engaged with this channel. Excludes any people from your own team. |
| Deal contacts engaged | Count of people who engaged with this channel and have been in the buying group for any opportunity. Includes buying group associations via both CRM contact roles and Upside's healed buying groups. Excludes any people from your own team. |
| Opportunities influenced | Count and total amount of opportunities influenced by this channel. |
| Won opportunities influenced | Count and total amount of won opportunities influenced by this channel. An opportunity is considered influenced if any associated contact engaged with the channel. |
| Sourced opportunities (SFDC) | Indicates the number and total value of opportunities in Salesforce attributed to campaigns of this channel type, based on the Primary Campaign Source field. Note: this metric may not be available on all dashboards and may differ from Upside-calculated values. |
| Opportunities created post-engagement | Count and total amount of opportunities that were created after channel engagement. |
| Opportunities influenced in-cycle | Count and total amount of opportunities influenced by this channel during their active cycle. |
| Progressed opportunities | Count and total amount of opportunities that progressed after channel engagement. |
| Opportunities with activation milestone citation | Count of opportunities where AI analysis identified this channel's touchpoints as influential in opportunity activation. |
| Won opportunities with activation milestone citation | Count of won opportunities where AI analysis identified this channel's touchpoints as influential. |
| Accounts activated | Count of accounts that had no engagement at any time prior to engagement with this channel. |
| Accounts reactivated | Count of accounts that had no engagement for 90 days prior to engagement with this channel. |
| Accounts engaged outside opportunity cycle | Count of accounts that have engaged with this channel and have no associated opportunities in the last 90 days (based on opportunity created or close date). This can help identify potential pipeline gaps. |
Channel List View
-
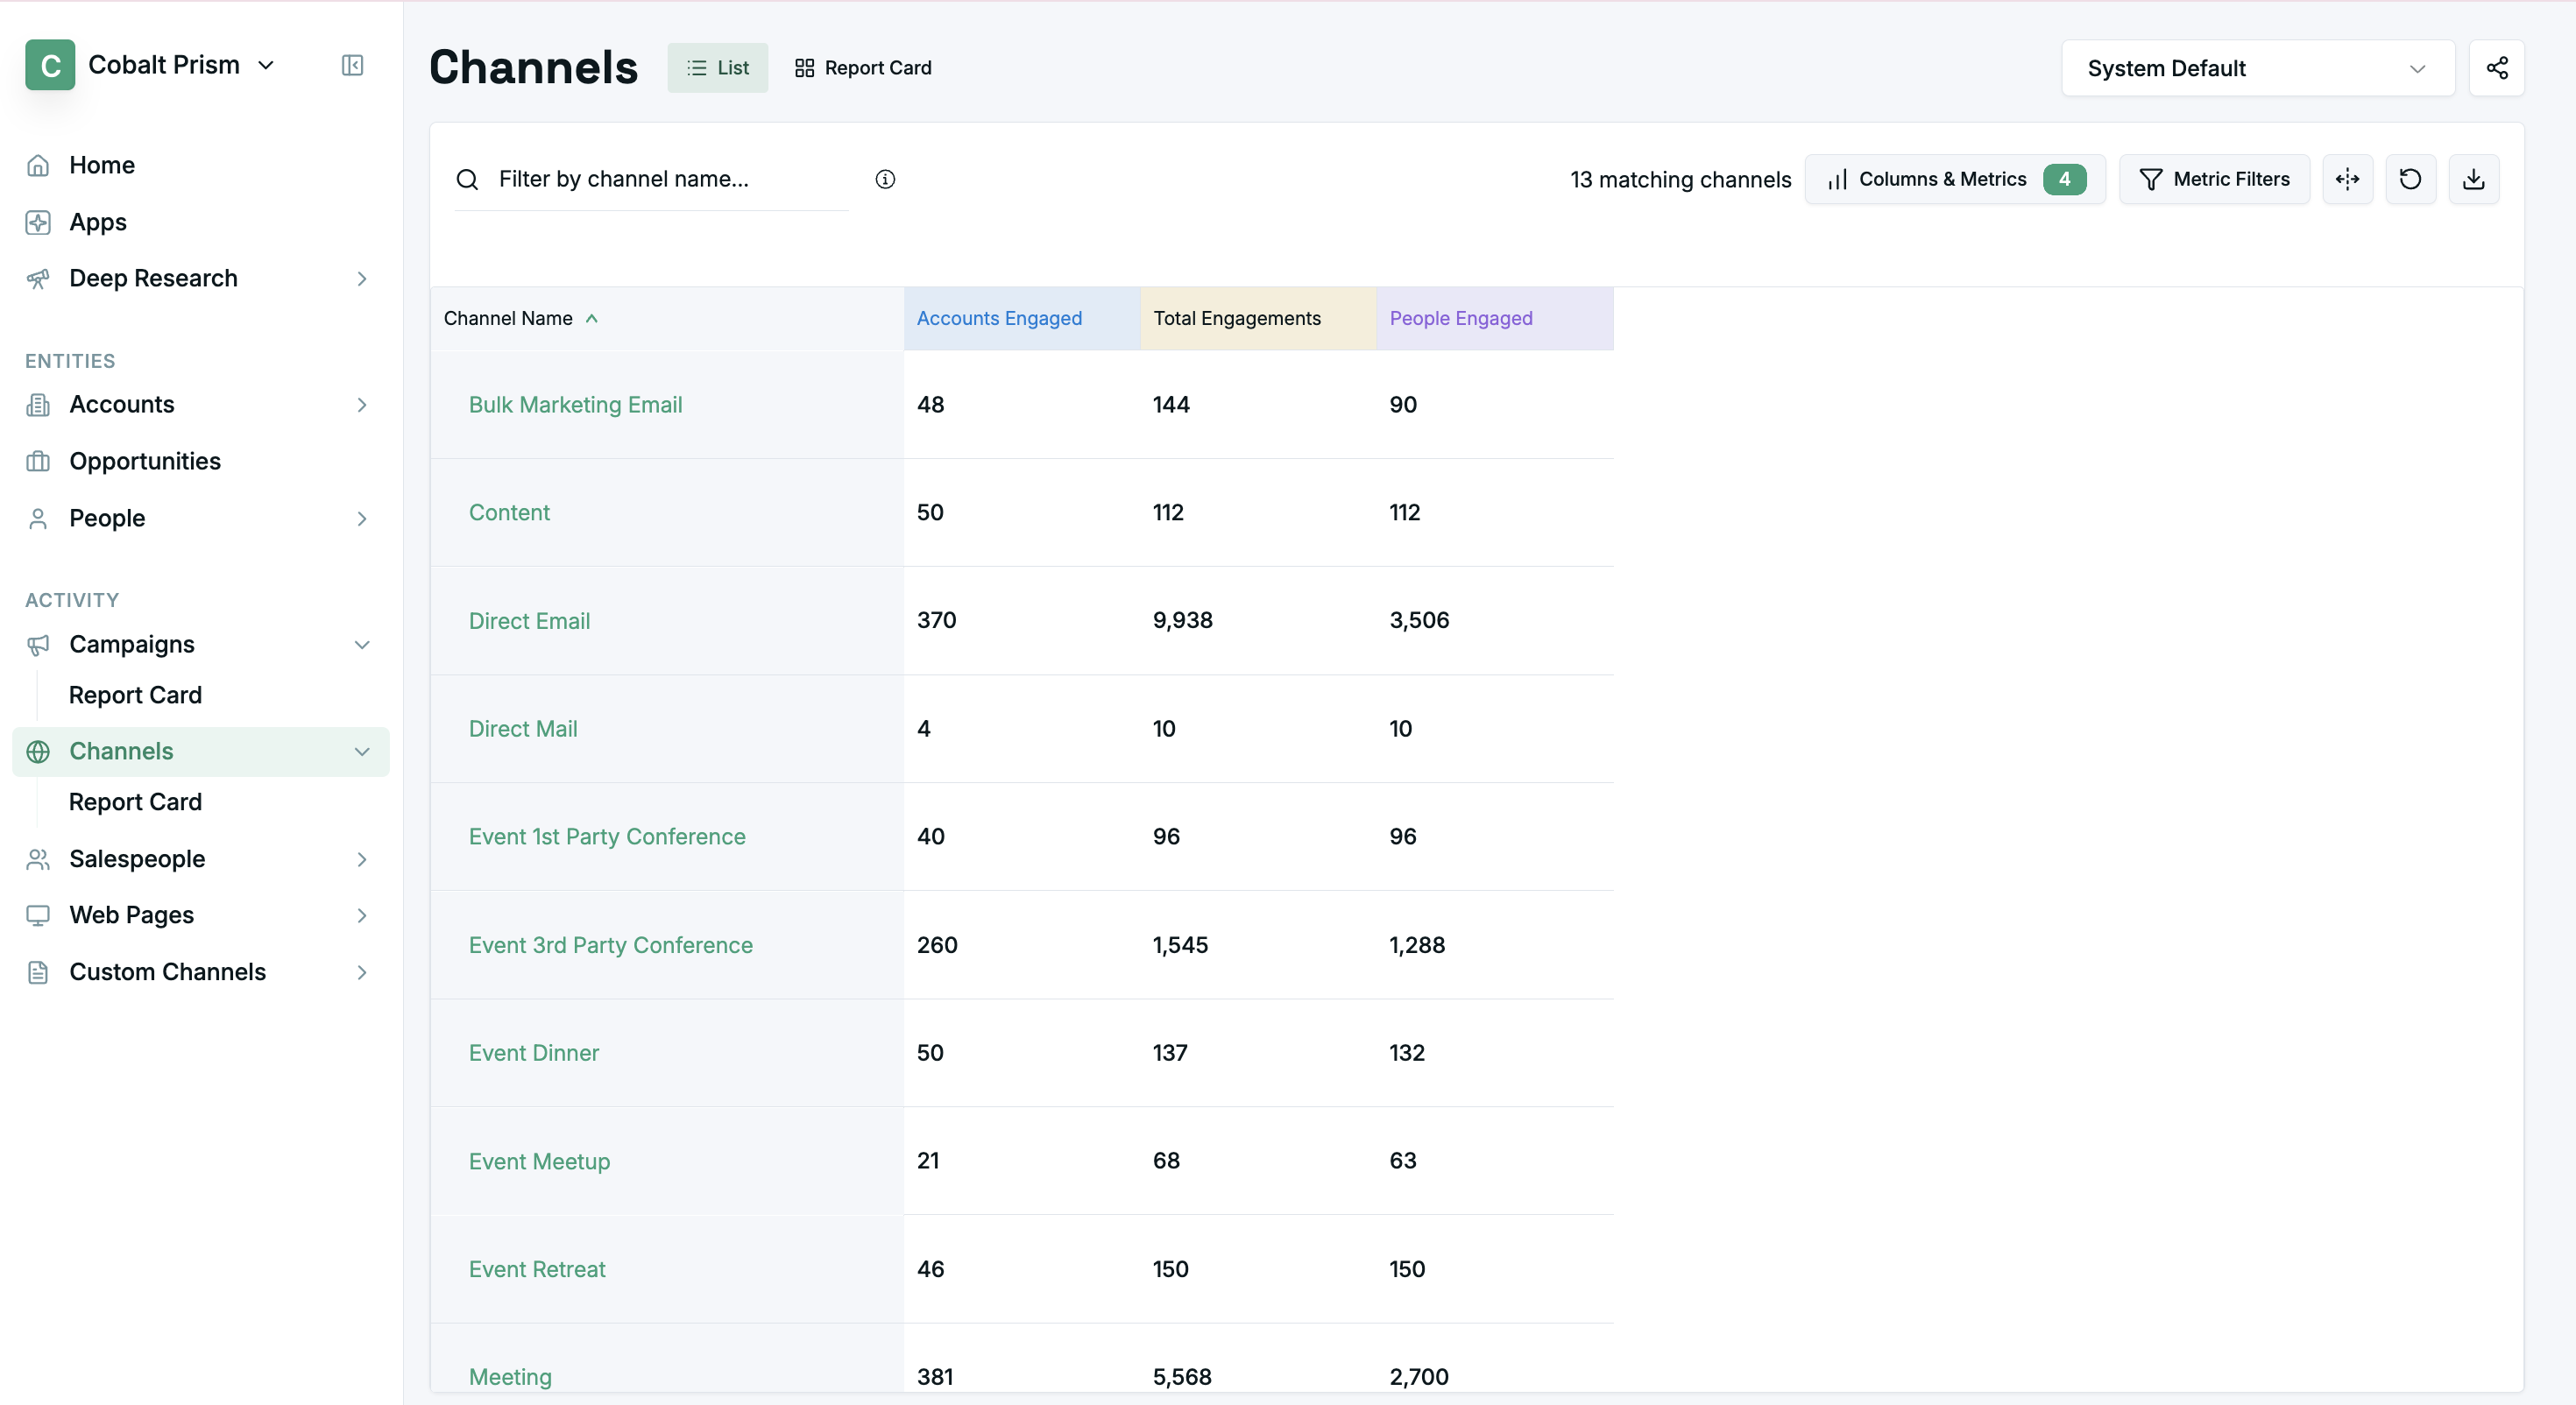
The Channel List View page displays a list of all channels, to help you more easily find the channel you want to view a report card for and compare metrics easier.
-
You can filter the results by using the header of any of the columns and select/deselect the visible columns and metrics.
-
You can click on any channel name to view more details.
Special Table Functions
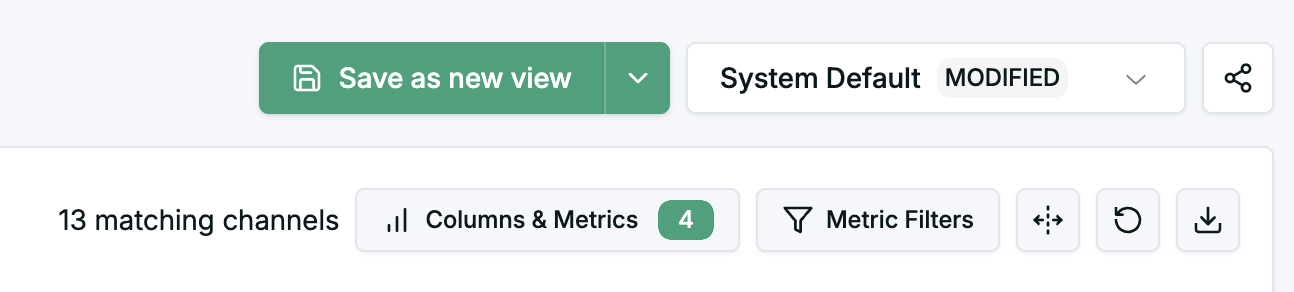
- Save as new view - Saves current columns and filters as a “view”
- View dropdown - Select saved views to apply
- Share view - Use share button to share current view or saved views as a URL